i) The effects of animal class, ‘dairy’ v ‘meat’, interacting with fertiliser N input rate
‘Yield’ responses to fertiliser N inputs are widely seen in terms of how the fertiliser stimulated plant growth, and hence the supply of forage to animals, per ha. This leads to the impression that fertiliser N inputs can be used to predict plant growth and the supply of forage, and this information (a single fertiliser response curve) can be used to determine the outcomes for grazing systems, independent of the physiological state and species of the animals grazing. But very different responses arise at the level of the whole grassland system, and its environmental impacts, when the grazing animals are ‘dairy’ compared to ‘meat’.
This is due to the very substantial differences in the fate of N (moreso than of C) in lactating animals, compared to non-lactating animals. Many accounts (and models) fail to correctly account for the differences in the C balance (notably) but also the N balance, of animals in different physiological states. For full explanation see ‘clarifications’ which lays out details of how animals critically ‘uncouple’ the C and N cycles.
In brief, a far greater proportion of the N entering the animal is partitioned and so removed in products (milk notably in addition to ‘retention’) in lactating animals. The greater removal of N in milk (per animal, and so also per ha, as we are talking of a proportion of all N ingested) is very predominantly at the ‘expense’ of N that would in a dry animal have been excreted as urine. This leads to very substantially different outcomes, notably dynamically, on the components of production and impacts, as depicted below.
By contrast, the removal of C (carbon) in milk, in effect, in lactating animals, is at the ‘expense’ of carbon that would otherwise, in a dry animal, have been respired. The off take of carbon in milk, in dairy systems, does not impact adversely on the proportion or amount of carbon excreted in dung. The ‘apparent digestibility’ of the dry matter (DM) eaten remains the same or indeed is lower (hence the C and N in dung increases) in lactating animals (for explanation see here). The difference in the proportion of C respired (and note how, physiologically, respiration is associated with ‘energy’ production in animals) between ‘meat’ production and ‘milk’ production, is consistent with the long-standing observations (originally eg Blaxter 1961) that there is a different co-efficient of energy conversion for ‘milk’ production, vs ‘meat’ v ‘maintenance’ (when the energetics of respiration will be similar in all cases). In short, lactating animals respire some only 55% of the carbon they ingest, compared to some 70% in ‘dry’ animals.
But it is the fate of N that affects the dynamic outcomes, most:
Legend:
The graphs below show the effects of ‘dairy’ v ‘meat’, across a wide range of N fertiliser N inputs (x axis), on food production (a); the total amount of C sequestered (b); the total rate of release of N to the environment (c) and the rate of emission of methane (d), all expressed per hectare. The solid line depicts ‘meat’ systems (cattle or sheep in general), and the dashed lines depict ‘dairy’ systems (which could equally be either cattle or sheep lactation based). The points (symbols) along each line are the solutions for each of a range of fertiliser N input rates (of 15, 30, 60, 150, 300, and 600 kgN/ha/year). All outputs here are receiving adequate rainfall, and based on the met data and soil type for Ruakura, NZ. All are the long-term sustainable rates and states predicted by the model, noting that outcomes in the shorter term, including then those even from direct experiments/empirical measurements, can reflect temporary transients, some which run counter to what the final outcome will be after the whole system has re-adjusted (see publications). All are based on stocking rate being optimally matched to the rate of supply of fresh forage (see ‘Methods’ section here). This overcomes the scatter and distraction of simple ‘mis-management’ of pasture.
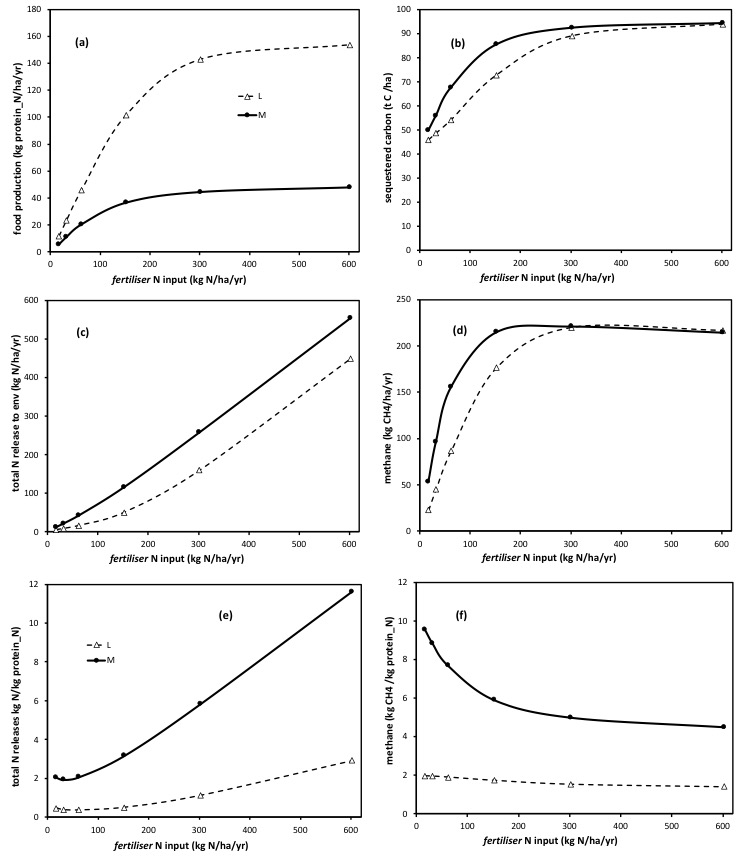
The difference in the fate of N within the animals (‘dairy’ v ‘meat’) is most evident in the far greater rate pf yield of animal products (expressed here in kg protein_N/ha/year, for consistency across milk and meat) at all rates of fertiliser N inputs, see (a).
As a direct consequence, this leads short term, and moreso as depicted here, long-term, to a reduction in the absolute rates of release of N to the environment, at all fertiliser N input rates, see (c), in dairy (lactating) animals compared to meat (dry) animals.
Differences arise in the amount of C sequestered in dairy v meat systems, at the same fertiliser N input rates, see (d), and these arise as a consequence of how the sustained greater removal of N (note) in products, at any given sustained N input rate, leads to a sustained lower availability of N in the system. So it is the removal of Nitrogen (in products) that leads to the reduction in the sequestration of Carbon, and not the removal of carbon (in products) per se.
The lower sustained emissions of methane per ha, in dairy v meat systems, reflect this lower N ‘status’ in the system (plant growth is relatively more N limited under ‘dairy’ v ‘meat’), and so the lower amount of carbon sustainably entering the system in photosynthesis. This relative reduction in photosynthesis (at a given N input rate) is not sufficient, by far, to prevent there being a substantially greater yield of products under ‘dairy’ than under ‘meat’ (as evident in (a) ), but it does account fo why the yield response to N is ‘flatter’ (closer to linear) in (a) for dairy, than it is for meat.
The differences in the fate of N, between dairy and meat, are what gives rise to very substantial differences in the ’emissions intensities’, see (e) and (f). (It is the difference in the denominator in particular that affects this measure).
Note too, however, that the changes in the fate of N in lactating animals means that ‘dairy systems can yield some 2 x higher products, for some 2 x lower N releases, when compared at the same fertiliser N input rate.
The emergent N-use efficiency (NUE) of dairy v meat is shown here:
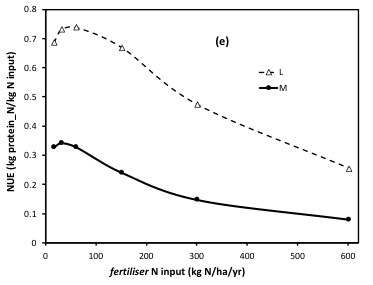
It is very important to note that this is an emergent dynamic nitrogen use efficiency, that arises net of all the inputs, cycling, recycling and fate of N in the system. This must not be confused with the ‘efficiency of utilisation’ factors that are input into descriptive models (based on observations of eg what proportion of the standing plant biomass N content, enters the animal, or even enters the products). Note, accordingly, that the NUE alters (declines) as more N fertiliser is added, even though in al cases, the model is sustaining an optimal utilisation of pasture (matching animal numbers and their changing intake demand, dynamically, to the rate of supply of forage).
Histograms, comparing the outputs and impacts of ‘dairy’ v. ‘meat’, side by side, at each of three fertiliser N input rates, can be seen, under ‘farm systems comparison’.
All analyses on these web pages involve (and so depict) the effects of ‘dairy’ v ‘meat’, and so consider interactions between animal class, fertiliser N inputs, supplements and irrigation.