Different ways of altering the total size of the livestock industry have very different outcomes !
First with respect to nitrogen release/emissions:
In the graphs below we take the outputs of the model for ‘dairy’ (dotted lines) and for ‘meat’ (solid lines), that in all previous graphs have been expressed per hectare, and scale these up simply to either one million hectares (open symbols) or two million hectares (closed symbols). The points along each line are outputs for either 60, 150, or 300 kg fertiliser N inputs per ha per year (the higher input being ‘up’ and to the ‘right’).
The recent increase in the total area under ‘dairy’ in NZ has been of this order (a doubling from 1 million to 2 million ha), and this, of course, simply shifts all points exactly x2 up/along both axes. We have scaled ‘meat’ outputs in the same way. Doing both allows us to consider what the effect would be not just of reducing the size of the dairy industry, but of substituting some of the current dairy area, for ‘meat’ (sheep and beef), whether at the same of lower fertiliser N inputs.
Three options are then depicted:
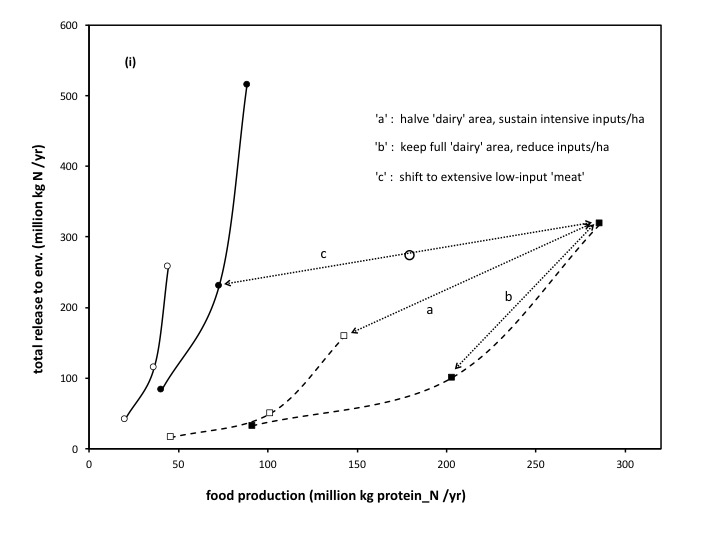
In Figure (i) for N releases …
(a) Halving the land area (from 2 million ha back to 1 million ha) but while sustaining the higher (eg 300 kg N/ha/year) inputs, as in line ‘a’ on the graph, of course simply halves both food production and total N releases.
(b) But maintaining the full (2 million ha) land area under dairy, but reducing the intensity of fertiliser N inputs (from eg 300 kg N/ha/year, down to 150 kg N/ha/year (see line ‘b’) has a very different outcome. Due to the non-linearity in how N release to the environment varies with eg fertiliser N input rates, this second option sustains far higher (food) production , and yet lower N releases to the environment, than would a simple halving of the whole dairy industry area. Compare the outcomes of ‘b’ with those of ‘a’.
Both options would involve ‘fewer cows’, but clearly a call for “fewer cows” (a reduction in the total national dairy herd) alone is too imprecise a strategy. It would miss that, within this, there were alternative, arguably better, options.
(graph repeated for convenience when reading)
(c) the effect of a shift from 2 million ha of ‘dairy’, and a complete substitution of that with 2 million ha of ‘meat’, and notably ‘meat’ run hence ‘extensively’ and at a lower N input rate than for dairy, is evident in line ‘c’. This would give rise to a major decrease in food production, and for far less reduction in N releases, than either of the other options.
A total substitution of that nature is arguably unlikely, but is illustrated first, as it creates a line from which we can assess any degrees of partial substitution. For example, if just one million ha of the current dairy land use were substituted for one million more ha of ‘meat’, then that resulting 2 million ha (50:50 dairy and meat) would lead to the ‘point’ shown by the ‘open-circle’, drawn indeed half way along line ‘c’.
These were chosen examples, to illustrate, but the graphic can be used to consider a move between any starting point, and eg between any starting and ending fertiliser N input rates, and any substitution by area.
Then with respect to methane emissions:
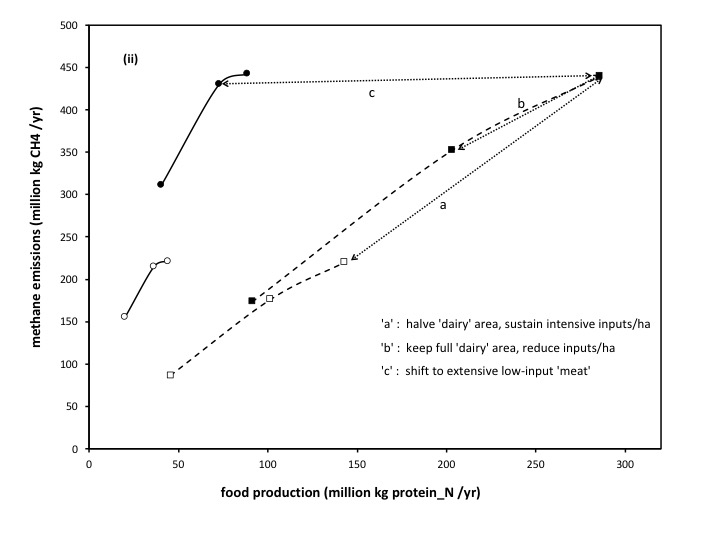
A similar approach can be applied to consider the effects of changes in industry size, nitrogen inputs, and animal class, on methane emissions (see below).
Because the relationship between methane emissions and food production within any one animal class is closer to linear, options ‘a’ and ‘b’ lead to similar proportional reductions in both food production and methane, though noting that halving N inputs per ha (‘b’) sustained far higher both food production and methane emissions than did halving the total area in dairy (‘a’).
But, this is not the case for any shift from ‘dairy’ to ‘meat’.
A shift (see line ‘c’) from intensive (300 kg fertiliser N/ha/year) ‘dairy’ to the same area of lower intensity ‘meat’ production, would substantially reduce food production, with little to no reduction in total (industry wide) methane emissions. Even reducing fertiliser N inputs to just 60 kg N/ha/year (hence a shift to ‘extensive low N input meat’), as seen by dropping the left hand end of line ‘c’ to the lowest point on the ‘meat’ line, would reduce food production substantially more than it would reduce methane emissions.
While we are talking here about total (absolute) emissions, and not about ‘efficiency’ (‘intensity’ or methane per unit food), it remains clear that substituting any part of 2 million ha of an intrinsically higher food producing system, with an area of lower food producing system, will be relatively ineffective in reducing total (absolute) methane emissions. But will reduce total food production.
Note that the relationship between methane emissions, and food production, is close to linear not just for situations (as above) where intake per ha (by animals) has been increased by the use of fertiliser N inputs to increase plant growth/forage supply, but also where plant growth (and so intake per ha) have been increased by irrigation (see ‘irrigation’) and where intake per ha has been increased by supplements (see ‘supplements’). As a result, unlike the case for releases of N to the environment, there are fewer options for altering the balance of food v environmental impact, wrt methane, than there are for food v N releases. But shifting from dairy to meat, per se, is by far the worst option in the case of methane for improving the impact v production balance.