Reflections on the H-Index
September 6, 2013
You can tell that an idea has become really well-known when senior management hears about it, and a few years ago I began receiving phone calls from heads of department along the lines of “I’m carrying out staff evaluations and suddenly people are telling me about their h-index. What on earth is an h-index?” I don’t recall exactly what I replied, but it probably wasn’t with the formal definition of the h-index which comes from a 2006 paper by Jorge Hirsch, An index to quantify an individual’s scientific research output, which is that “a scientist has index h if h of his or her Np papers have at least h citations each and the other (Np – h) papers have ≤h citations each.” The wikipedia entry puts it rather more elegantly – “a scholar with an index of h has published h papers each of which has been cited in other papers at least h times,” so that’s probably more like what I said.
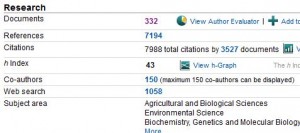
At the time it might have seemed like one of those passing fads, but the h-index has stuck around and I think that’s because, along with that other perennial favourite the Journal Impact Factor, it’s fairly easy to understand and it does make a certain amount of sense. Unless you are totally disinclined to assign a number to a quality judgement (and there is a good case to be made for that) then this one is at least based on some solid observable data and, in its pure form, doesn’t rely on any algorithms or weightings that would make it less transparent. Added to that it seems to be, within the sciences at least, a fairly robust phenomenon that can be measured at much the same level in both Scopus and Web of Science. To illustrate this, and demonstrate how to calculate an h-index, I’m going to take the example of the Dutch bird migration expert Theunis Piersma. If you look him up on Scopus (using an author search) and go to his author record here’s what you find –
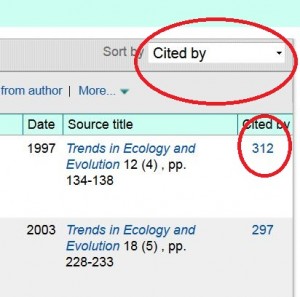
(Those of you fortunate enough to have a Massey login can click here to work along.) What this means is that Piersma is the author of 323 articles in the database and 43 of them have been cited 43 or more times by other articles in the database. If we click on the number 323 we can actually see these records and then sort them by the number of times that they have been cited. You will notice that the top paper has received 312 citations, the second 297 and so on.
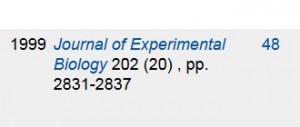
Now if we scroll down, and turn the page a couple of times, we come to the point where the number of the left (the position on the list) is equal to the number on the right (the number of citations) – that number is the h-index. (Tada!)
You’ll notice, by the way, that this number is actually 48 rather than 43 as indicated a couple of screens back. This just means that the Scopus author records can be a little out-of-date and Piersma’s h-index is probably increasing quite rapidly. I’m not on a campaign to find flaws in Scopus, or at least not today, and I think it’s a terrific database and the best for this particular purpose.
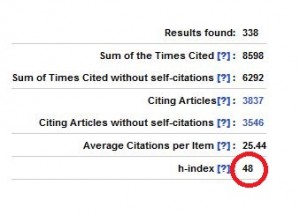
Anyway, you’ll recall that I said that in the sciences the h-index is a relatively robust figure, and the best way to illustrate this is by looking Piersma up in Web of Science where we find his h-index is, wait for it –
(Tada Tada!) 48. So, even though some of the details vary the nett result is the same, and it is not at all unusual for Scopus and WoS to track really closely in this way. Both databases cover all the significant journals in this area, the titles that the authors will have published in or been cited in, and this really is a “big data” figure. Even if the figures were not quite this close, we can be absolutely confident that Piersma is a well-published author whose work is regularly mentioned in the work of other authors, so in this instance the h-index is an indicator of a real phenomenon, no doubt about it.
But of course there is always doubt. Hirsch concluded his article by observing that “this index may provide a useful yardstick with which to compare, in an unbiased way, different individuals competing for the same resource when an important evaluation criterion is scientific achievement,” and this is exactly where its significance lies and why it continues to be controversial. “Different individuals competing for the same resource” is another way of talking about applicants for jobs or grants, tenure or promotion, and it is now very common practice to have the Hirsch figure available to members of committees needing to compare individuals. Even if the figure isn’t on the table, you can be pretty sure that someone will have quietly looked it up. However much we dislike it, the h-index is not going to go away and we need to understand both its strengths and its weaknesses.
The first point to note is that Jorge Hirsch is a physicist and that his work was based on an examination of physicists and talked only about scientists. Scientists typically write large numbers of short journal articles (with substantial lists of references) and relatively few books. Even their conference papers are likely to end up as journal articles and it is this behaviour that generates the large amounts of data, concentrated in large databases, that can make of the h-index a relatively well-calibrated tool for use in certain disciplines. However, even within the sciences typical publishing patterns vary widely and h-indices in engineering, for example, or veterinary science will be much lower than in physics, while medical scientists will generally expect to have higher h-indices than any of these groups. Hirsch himself recognised that his index was very discipline-specific and made no claims to have created a one-size-fits-all yardstick.
On top of that, once we get outside of the sciences the whole thing begins to fall apart, or at least to lose its apparent simplicity and transparency. Here’s an example from my own field, library science. (Physicists, stop smirking!) In a 2008 article Testing the Calculation of a Realistic h-index Péter Jácso of the University of Hawai’i looked up the h-index of a leading information scientist F.W. Lancaster on Web of Science and got the figure 13, which struck him as being surprisingly low for an eminent and prolific scholar. The explanation turned out to be that the figure could only be generated from citations of documents published in journals indexed by Web of Science, and the citations to those documents must also come from documents published in journals indexed by Web of Science, whereas Lancaster’s most highly cited works were books. Now, even when you can find citations of these books (in journals indexed by Web of Science) these do not contribute to the WoS h-index because it is generated only from WoS documents, the so called “master documents” in the lists we looked at above, although our example was from Scopus. In other words for the purposes of the h-index, WoS was a closed universe – which just happened to be almost identical to the whole universe of a physicist like Hirsch. What Jácso then did was to spend considerable time calculating Lancaster’s “realistic h-index” which he put at 26 – and of the 26 documents that contributed to this score only 10 had “master records” in WoS and most of the others were books. What is worrying about this, then, is not just that the original figure was “low” but that it was, as Jácso pointed out, unrealistic and not based on Lancaster’s actual work – another scholar in the field who had been much less important could conceivably have reached a comparable figure on the basis of journal articles alone. It is not good enough just to say that “in some fields the figure will be lower” without bearing in mind that it may also carry much less meaning in terms of its stated purpose of ranking and comparing scholars.
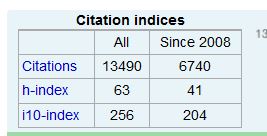
We would all be fortunate if a Péter Jácso descended from the clouds and created for us a credible “realistic h-index”, particularly if was double the size of the database-generated one, but that probably isn’t going to happen. No one has as much interest in your score as you have, and do-it-yourself efforts to ramp it up will inevitably suffer in terms of credibility. However, to get some idea of what your “realistic h-index” might look like Google Scholar can be quite helpful, particularly if you have “claimed” your publications. Here is Theunis Piersma on Google Scholar
When we compare it to the result we found in Scopus we find that the same highly-cited articles are still at the top but that the citation counts are higher and the h-index has risen from 48 to 63 as a consequence. Why is this? At least part of the problem is just plain unreliability, Google Scholar’s inability to avoid errors and in particular duplication of items. Here is Jácso on the subject –
“The extent and volume of inflated hit counts and citation counts cannot be fully determined, nor can they be traced and corroborated systematically, but even my chance encounters with absurd hit and citation counts, followed up by test searches for obviously implausible and often clearly nonsense hit counts and citation counts indicate the severity of the problems.”
Another issue is coverage. Google Scholar finds more citations because it looks in more places. When I looked at the works that had cited one of Piersma’s articles I didn’t find any duplication and the difference seemed largely to be explained by citation in theses, which seems harmless enough although it doesn’t really add much to our understanding of the importance of the work – if it is cited in a lot of theses a work of this sort will already have been cited in a lot of articles. However, I know from looking at citations of one of my own work that I can probably discount about a third of them as not appearing in serious peer-reviewed documents – one of them is in a piece of student work, another is in a PowerPoint and so on. Citations can also be traced back to working papers in repositories like Social Sciences Research Network, the peer-review status of which is undetermined, and then there is the rapidly growing phenomenon of junk academic publishing. Leaving aside the issue of peer review, the fact that articles can appear in the list of references of an article without appearing in the text creates obvious distortions and the potential for manipulation. Being a search engine Google Scholar takes what it finds in those parts of the Internet that its spider covers and no value judgment is implied, whereas inclusion of an article in a database carries an understood seal of approval that carries across to those documents it has cited. (Right guys?)
So what can we do with our big fat Google Scholar h-index? The sad truth is probably not a lot. I was at a meeting recently where a staff member of MoBIE (the Ministry of Business, Innovation, and Employment, the main distributor of state research funding in New Zealand) said that “”we just laugh when someone tells us their GS h-index,” and given the concerns raised above that is probably fair enough. On the other hand, if you’re into thinking about bibliometrics and your Hirsch score then it’s a pretty good idea to create a profile, claim your work and set up an alert so you are notified if one of your publications is cited. It may yield useful information about its impact and the fact that it has shown up in a thesis may be of interest. This implies more of a portfolio approach to your research rather than a purely metric one, and that might be the subject of a future LOL post.
There are a number of other problems with the h-index that Hirsch touched upon in 2005, but that probably merit highlighting. As already noted, some fields do much better than others simply because of the number of people working in them – the more potential citers then the more citations there are likely to be. This is well-recognised, and the so-called Crown Indicator seeks to create norms for individual disciplines, but it could potentially work within fields of research as well, and work that is highly specialised and even groundbreaking could attract less measurable attention than more mainstream activity. Another thing about the h-index is that it measures and rewards a certain type of behaviour, namely the practice of publishing a large number of separate documents. That is pretty standard practice in the sciences and undoubtedly those with significant scores have got them by doing some pretty significant work – it would be difficult to reach a score of 43 without getting out of bed fairly early each day – but as Hirsch observed “the converse is not necessarily always true … for an author with relatively low h that has a few seminal papers with extraordinarily high citation counts, the h-index will not fully reflect that scientist’s accomplishments.” The g-index is another measure that attempts to account for this by taking into account large numbers of citations of individual papers, but the truth is that sometimes real importance or value may simply not be assessable by the use of a metric.
The final caveat that Hirsch raised was the question of authorship, one which bibliometrics as it currently stands has no simple answer to. As it stands anyone who is named in the list of authors gets the full value of the citations no matter what their role, so that each one of the nearly 3,000 authors of one 2008 paper on the Hadron Collider gets the full value of the 563 citations it has so far received. Actually as a measure the h-index is relatively well equipped to deal with this particular case. If any of the authors has only this one paper to their credit then they will have a citations per article score of 563 (wow!) but their h-index will still only be 1. (Think this through – if you get it then you understand the h-index.) On the authorship question as a whole the Hirsch score is probably reasonably robust at the higher end – nobody gets to be co-author of a large number of well-cited papers without being a smart cookie and a good contributor – but one can imagine the case where a statistician attached to a productive research institute could rack up a pretty good number by being a competent Johnny-on-the-spot.
The other thing the h-index doesn’t, of itself, take into account is time. It is sometimes called a “lifetime achievement measure” and, while you don’t have to wait forever to reach a respectable number, it does not accommodate early stage researchers, some of whom tend to dislike it immoderately and reach for their altmetric scores instead. I guess that looking at the scores of older colleagues might be a bit like knowing exactly how high the mountain you are climbing is, and in the first few years when there are only a few publications with which to hook citations progress probably seems unbearably slow. In similar vein, it doesn’t measure current or recent activity – unlike us, the h-index never goes into decline and can continue long after research activity has slowed down or ceased. It is possible, and important if the figure is being used for promotion or grant applications, to take a reading of the h-index of an author’s publications over the past eight to ten years to determine their current status, although there is a risk that if this is shortened to, say, the last five years then the figure may be skewed in favour of those who published more work five years ago as opposed to those who published in the past two or three years – citations, like cheese, take time to mature.
So, those are just a few thoughts on the Hirsch Index. Until something else comes along that is not only more robust but also as easy to understand then it will be with us, just like the Impact Factor. The point about numbers in a case like this is that they are indicators, not things, and any sort of metric requires closer examination to extend it into a valid depiction of reality. If it is used to say “Dr X has a track record of publishing papers that are well cited, so if we give her this grant/job/leave then there is a good chance he will continue to do the same” then that is fair enough. On the other hand, though, if someone does not have this sort of track record because of their age, or from being new to scholarship, then this is not the place to look for evidence. I apologise for the length of this post, if anyone is still reading, but felt that there was no obvious point to cut it in two and that it was important to convey, to the best of my ability, the whole picture. If I’ve got any of it badly wrong please let me know, nicely if possible, and for those of you at Massey I’m always happy to answer questions and share ideas, as are my other colleagues in the Library.
Bruce White
eResearch Librarian
eResearch on Library Out Loud
Search posts
Categories
Tags
Recent Comments
- January 2026
- November 2025
- September 2025
- May 2025
- April 2025
- March 2025
- February 2025
- January 2025
- December 2024
- November 2024
- October 2024
- September 2024
- August 2024
- July 2024
- June 2024
- May 2024
- December 2023
- November 2023
- October 2023
- September 2023
- June 2023
- May 2023
- February 2023
- January 2023
- November 2022
- October 2022
- September 2022
- August 2022
- July 2022
- June 2022
- May 2022
- March 2022
- January 2022
- November 2021
- August 2021
- July 2021
- May 2021
- April 2021
- March 2021
- December 2020
- November 2020
- September 2020
- August 2020
- June 2020
- May 2020
- April 2020
- March 2020
- February 2020
- November 2019
- October 2019
- September 2019
- July 2019
- June 2019
- May 2019
- March 2019
- February 2019
- December 2018
- November 2018
- October 2018
- September 2018
- August 2018
- July 2018
- June 2018
- May 2018
- April 2018
- March 2018
- February 2018
- January 2018
- December 2017
- November 2017
- October 2017
- September 2017
- August 2017
- July 2017
- June 2017
- May 2017
- April 2017
- March 2017
- February 2017
- January 2017
- December 2016
- November 2016
- October 2016
- September 2016
- August 2016
- July 2016
- June 2016
- May 2016
- April 2016
- March 2016
- February 2016
- January 2016
- December 2015
- November 2015
- October 2015
- September 2015
- August 2015
- July 2015
- June 2015
- May 2015
- April 2015
- March 2015
- February 2015
- January 2015
- December 2014
- November 2014
- October 2014
- September 2014
- August 2014
- July 2014
- June 2014
- May 2014
- April 2014
- March 2014
- February 2014
- January 2014
- December 2013
- November 2013
- October 2013
- September 2013
- August 2013
- July 2013
- June 2013
- May 2013
- April 2013
- March 2013
- February 2013
- January 2013
- December 2012
- November 2012
- October 2012
- September 2012
- August 2012
- July 2012
- June 2012
- May 2012
- September 2009
- November 2008


Leave a Reply